LAB MEMBERS TREASURE MCMAHAN, MATCH KAY, ANDREW HAYES |
| We began by reading the PATS (Portland Air Toxics Solutions) summary and looking through the pollutant files to select a variable to study. We chose Diesel because we figured it could be easy to map geographically, and there may be a correlation between major highways and diesel emissions. We compared data from PATS to population and income data from the 2013 ACS (American Community Survey) data. From the census data, we decided to focus on the impacts of diesel emissions on Asian populations because the PATS summary determined that Asian populations are most effected by car and truck emissions (Figure 1.1). | 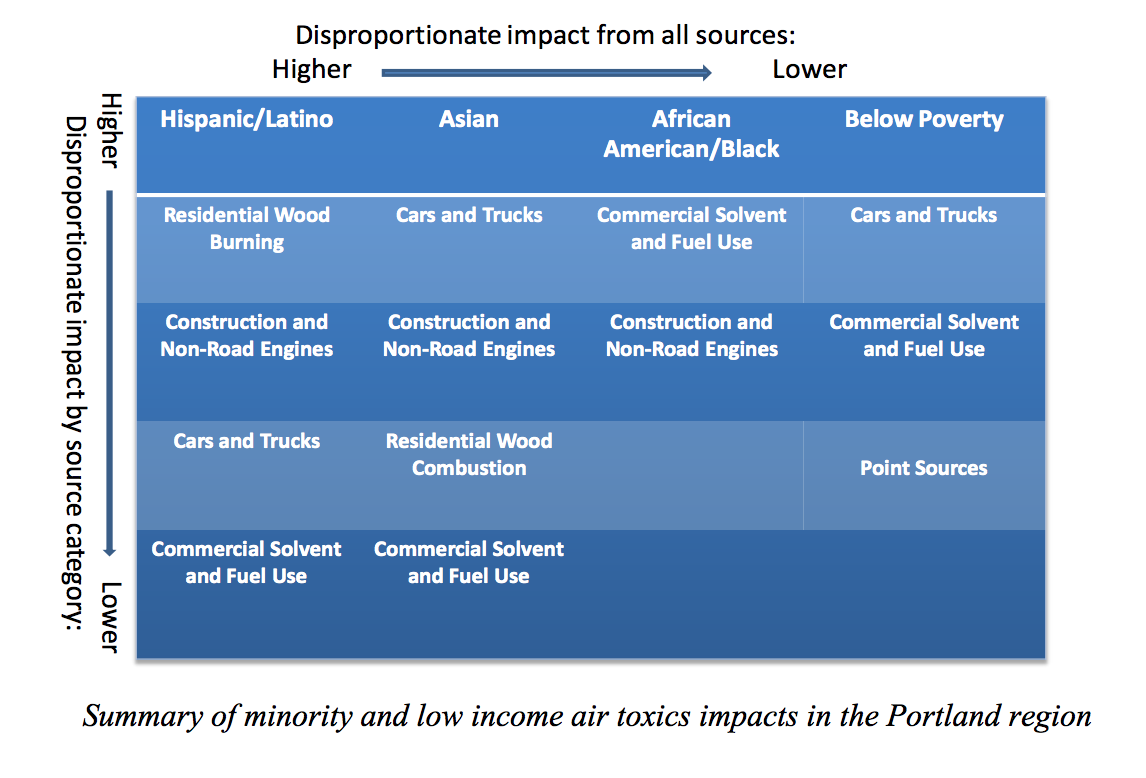 Figure 1.1 PATS Summary graph. Shows that Asian populations are highly affected by cars and trucks (diesel emissions). |
We downloaded .zip files containing PATS And ACS data into ArcGIS Online, and began the process of geographically mapping these data to look for possible connections to issues of Environmental Justice. We mapped the attributes our group selected form the PATS and ACS data, including diesel emissions, Asian population distribution, Non-White population distribution, and income over $100,000.
From these data, we created three separate maps to examine if different populations are disproportionately affected by diesel emissions: Diesel Vs. Non-White Populations, Diesel Vs. Non-White populations, and Diesel Vs. Income over $100,000. In order to create graphs for income over $100,000 dollars and to combine the data for all Non-White populations, we created new attribute fields to generalize these two items from the ACS data. We used SQL syntax to combine the data for all blocks that reported an income of over $100,000-$200,000. We operated under the assumption that higher income would act as an indicator of the Capitalocene. To create the Non-White attribute field, we combined African American Black, American Indian or Alaskan Native, Asian, Native Hawaiian or other Pacific Islander, and Hispanic or Latino. Our group assumed that mapping race against a pollutant could represent ideas behind Environmental Justice.
From these data, we created three separate maps to examine if different populations are disproportionately affected by diesel emissions: Diesel Vs. Non-White Populations, Diesel Vs. Non-White populations, and Diesel Vs. Income over $100,000. In order to create graphs for income over $100,000 dollars and to combine the data for all Non-White populations, we created new attribute fields to generalize these two items from the ACS data. We used SQL syntax to combine the data for all blocks that reported an income of over $100,000-$200,000. We operated under the assumption that higher income would act as an indicator of the Capitalocene. To create the Non-White attribute field, we combined African American Black, American Indian or Alaskan Native, Asian, Native Hawaiian or other Pacific Islander, and Hispanic or Latino. Our group assumed that mapping race against a pollutant could represent ideas behind Environmental Justice.
Results
We are operating under the assumption that the limitations of ArcGIS Online's mapping could obscure the smaller ACS blocks of data, however we do see a correlation between Diesel Emissions (particulate matter 2.5 microns or less in diameter) and density of Asian populations.
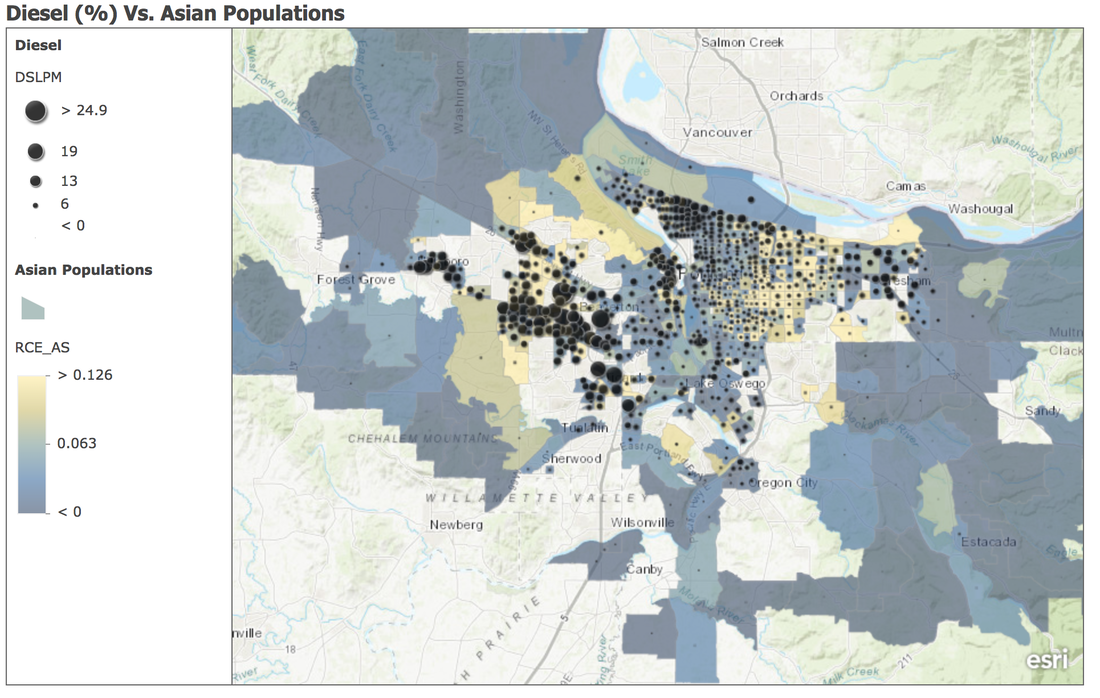
Figure 2.1 Map of Asian Populations Vs. Diesel Emissions in the Portland Metro Area
We did not observe a clear empirical correlation between Non-White populations and diesel emissions. This map does show a higher density of Non-White populations in North Portland and the Western suburbs.
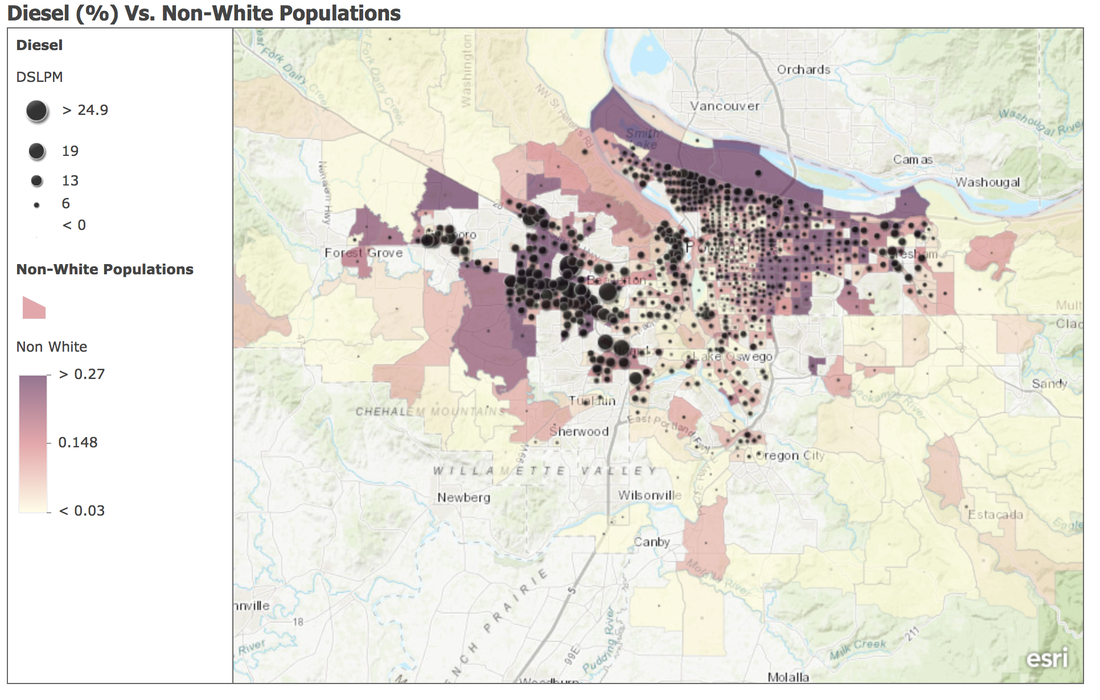
Figure 2.2 Map of Non-White Populations Vs. Diesel Emissions in the Portland Metro Area
Our last map, which depicts diesel emissions against high income ($100,000-$200,000) demonstrates that there are less individuals who earn over $100,000 in North Portland. However, this map does not depict a significant correlation between high income and diesel emissions.
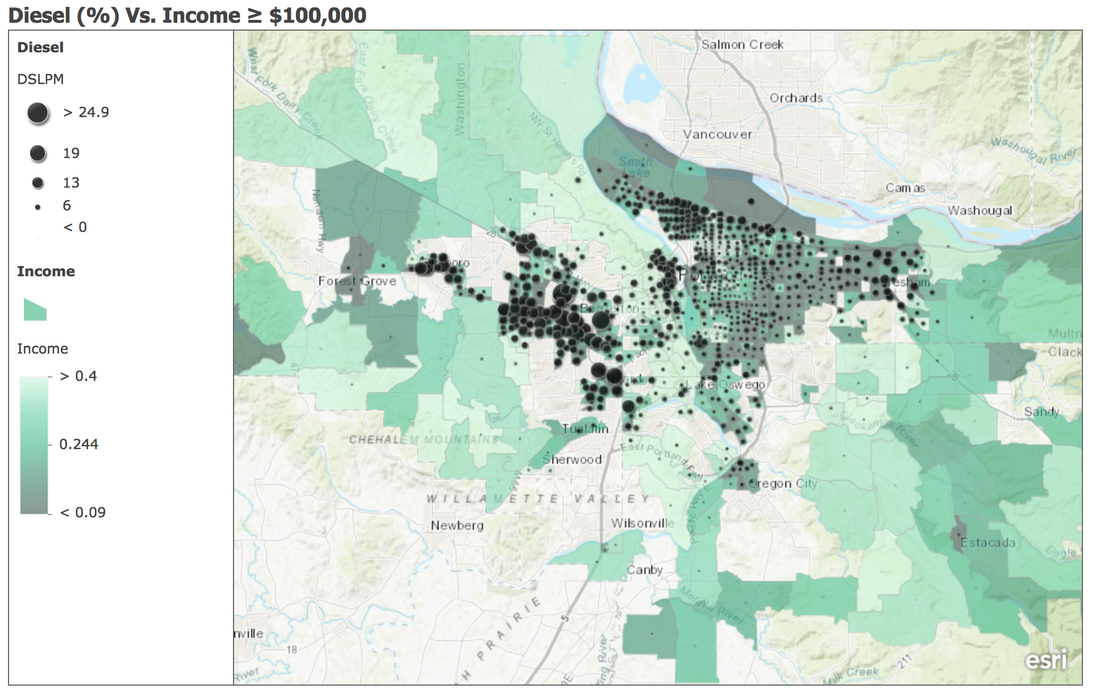
Figure 2.3 Map of Income over $100,000 Vs. Diesel Emissions in the Portland Metro Area
Discussions
For a thorough analysis of the Capitalocene, it is necessary to have an understanding of the intersections between income and race. In this lab, we narrowed our focus both geographically and in terms of the various facets of capitalism. We completed this lab with an understanding that Non-White populations do not have equal opportunities in comparison to the American White population. If we empirically depicted this assumption, we would see similar results to out other Capitalocene labs which focused on global data. Our past results demonstrated that "low income" countries have lower Environmental Protection Scores.
The .zip files containing the PATS and 2013 ACS data create a few limitations in terms of the validity of our findings. There are several income and population blocks that did not participate in the 2013 ACS, which include several highly populated areas of Portland. Our maps demonstrate that Non-White populations often live on the periphery of the city, and many of the suburbs have a small Non-White population as well. Downtown Portland and many of these suburbs are home to many individuals make over $100,000.
These findings highlight the limitations of distributive justice risk assessment. This also calls for a more theoretical approach when studying environmental justice. Completing a more thorough risk assessment would require more research into the historical motivators of White populations moving into downtown Portland the surrounding suburbs. Without this information, it is not possible for us to definitively conclude is there is a significant correlation between Asian populations and diesel emissions. If we were working with data over a greater time scale, we may be able to come to a more definitive conclusion regarding these variables. We do not know if there sources of such air toxics existed before the settlement of these Asian communities, or if institutional racism forced these populations into areas with higher toxicity.
The greatest source of Diesel Emissions, as determined by PATS, is "Mobile, On-Road Source". Meaning that major highways are the greatest source of diesel emissions in the Portland area. Because the source of our chosen pollutant is mobile, we are unable to determine if race is an important factor between risk and demographic statistics. Additionally, individuals are not confined to the areas in which they live. Our maps show were people reside, but we have no way of knowing the areas that people frequent, such as where they work or shop. Because of this limitation, our maps show the threat of toxicity in terms of where people live, but do not depict the threat of air toxins in other areas they frequent. When discussing issues of environmental justice prior to completing this lab, we hypothesized that real estate prices would be lower in areas prone to air toxicity, such as near major highways. While we can see this pattern somewhat reflected in our maps, we are unsure if this hypothesis is fully supported by our findings due to limitations with ArcGIS mapping capabilities.
Through the last 10 weeks of lab, we have observed that the Capitalocene provides more thorough analysis of the sources of environmental degradation than the Anthropocene. The Anthropocene proposes that human interference is the cause of environmental degradation, however the Capitalocene takes this theory further by asserting that environmental degradation is most severe in times of industrialization. The Portland area is considered a post-industrial economy, according to our findings in the past labs, this means that Portland prioritizes environmental protection.
All examinations of the Capitalocene should be multi-faceted and consider the impacts of environmental justice, as the the contributors to environmental degradation are incredibly diverse.
0 Comments
Leave a Reply.
Treasure McMahan
I am an Environmental Studies and Sociology/Anthropology double major at Lewis & Clark College. This blog page is where I will post my lab write-ups for ENVS 220 "Environmental Analysis"
Archives
December 2018
November 2018
October 2018
September 2018
 RSS Feed
