lab members Treasure McMahan, Match Kay, Andrew Hayes |
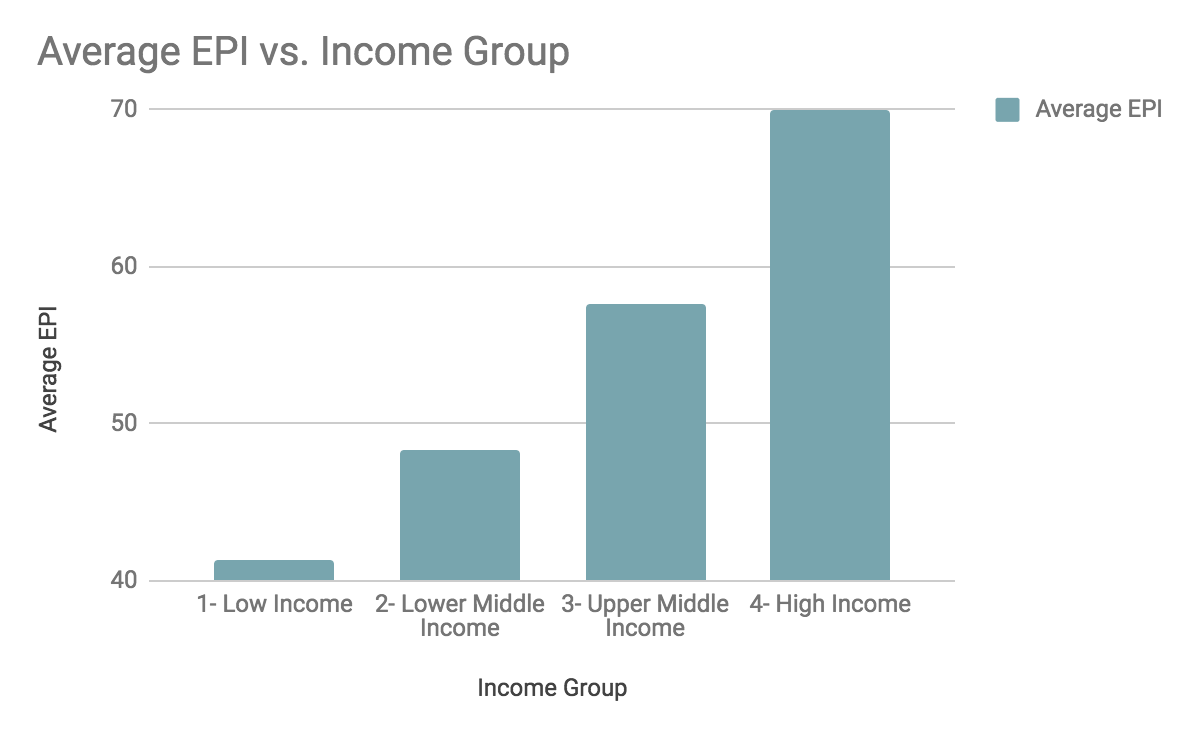 Figure 1.1 | 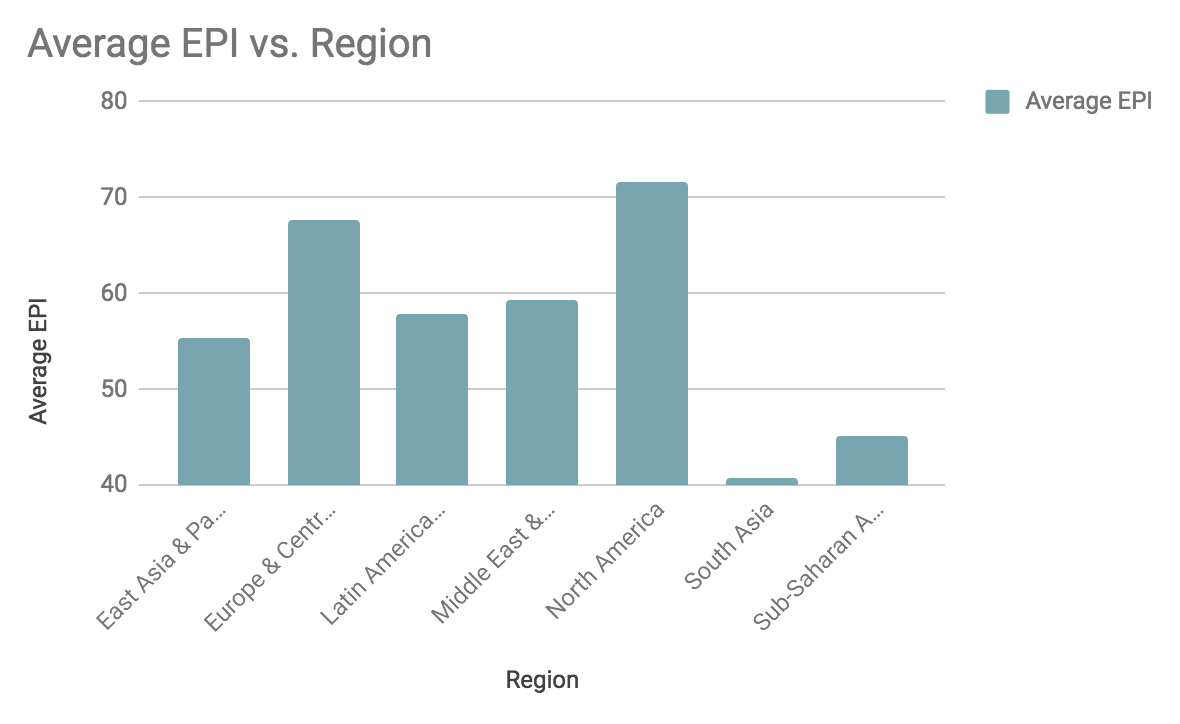 Figure 1.2 |
Our data analysis reveals that the average EPI increases as income levels increase (see figure 1.1). This data is significant because it directly contrasts our initial assumptions about environmental prosperity. It was our assumption that environmental performance would be higher in regions with lower income, due to the lack of urbanization and industrialization. When looking at the data comparing average EPI versus Region, North America has the highest average EPI (see figure 1.2), which also contrasts our assumptions about the link between EPI and regional development.
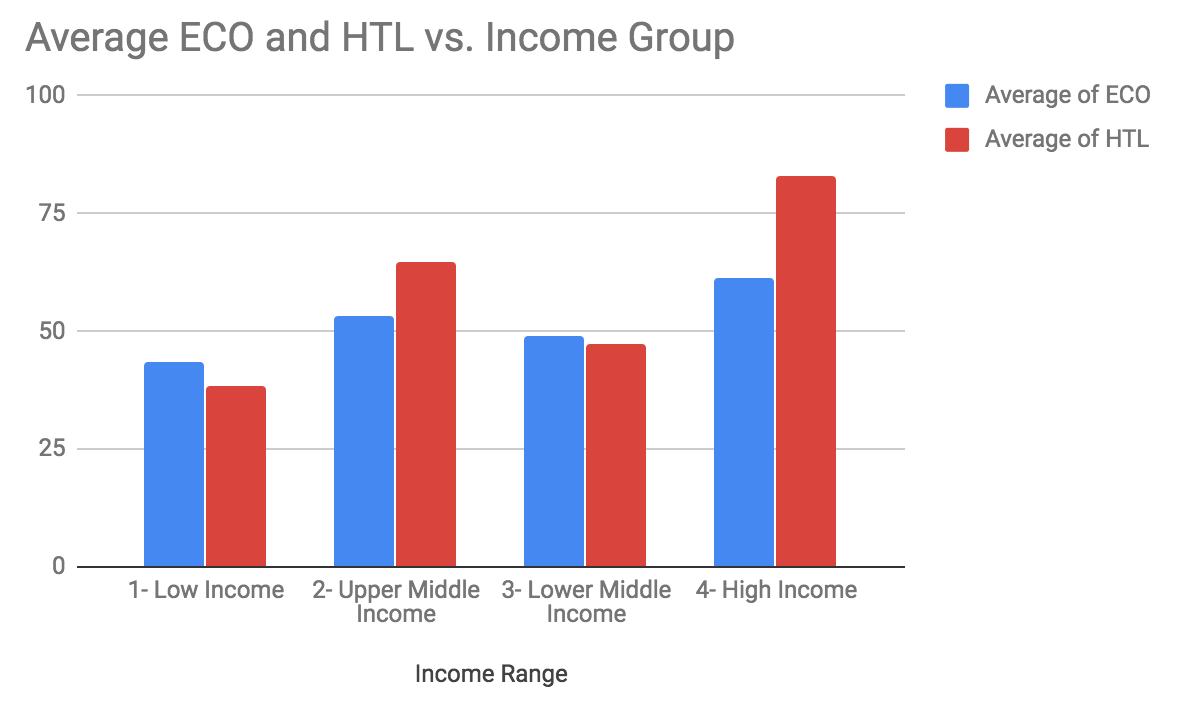 Figure 2.1 | 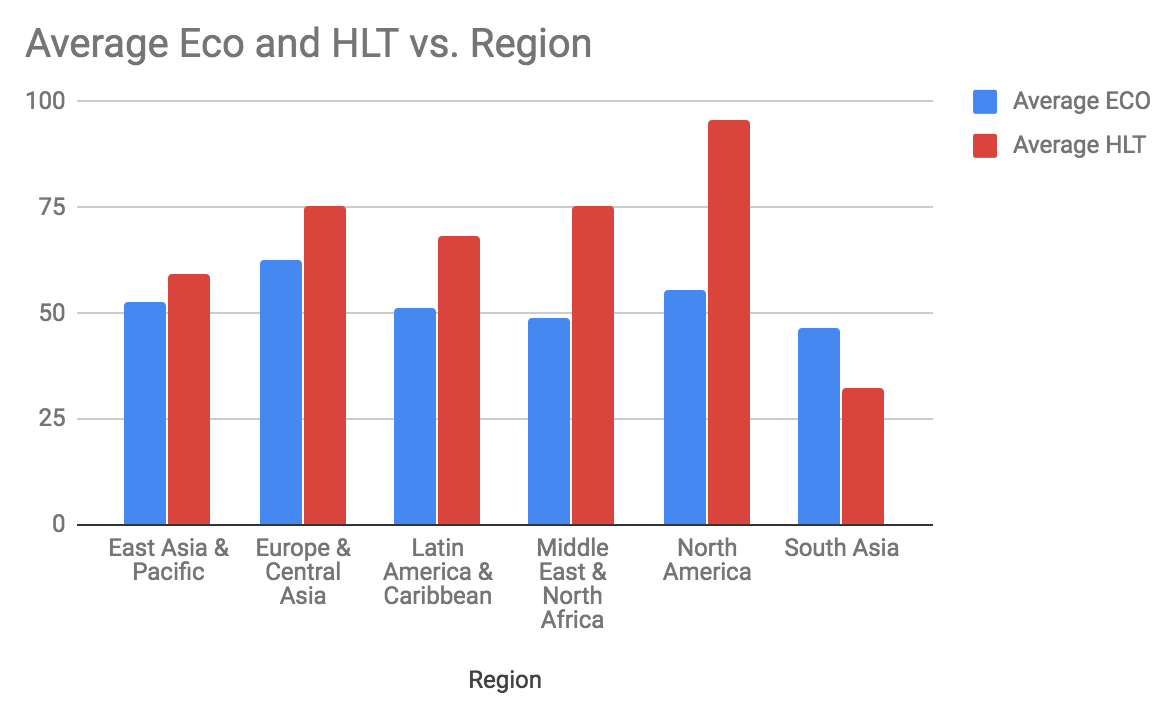 Figure 2.2 |
Figures 2.1 and 2.2 above are included to provide a break down of the average EPI vs. income group and region.
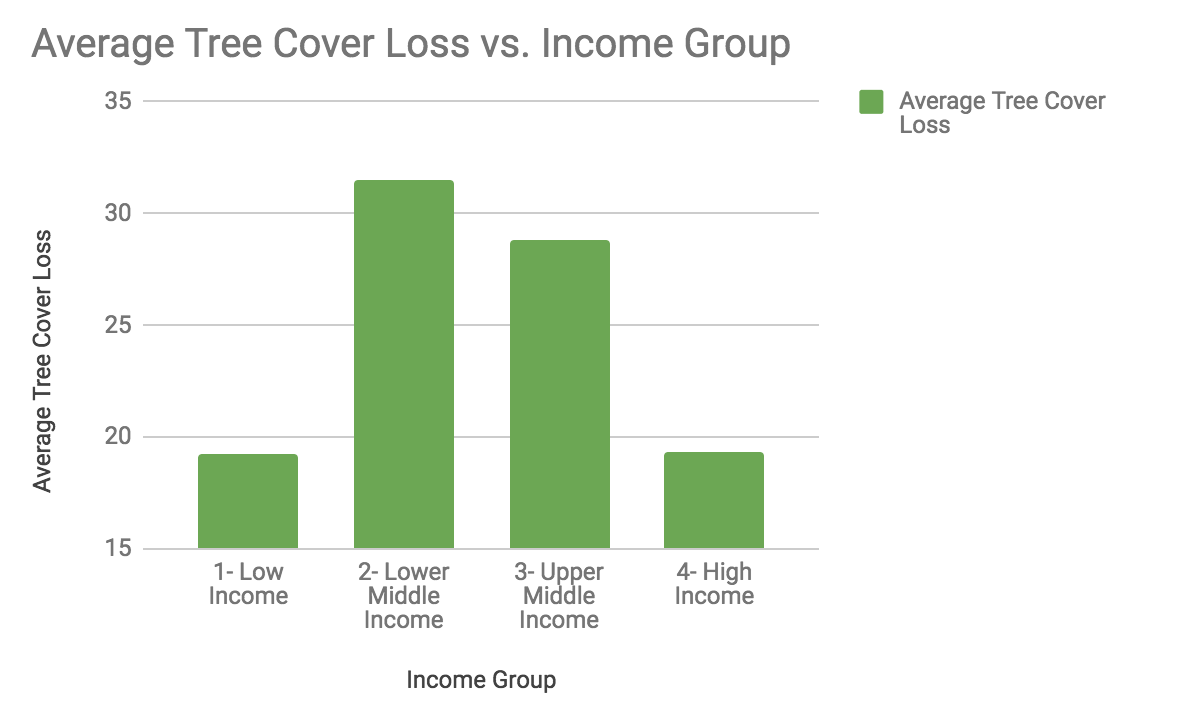 Figure 3.1 | 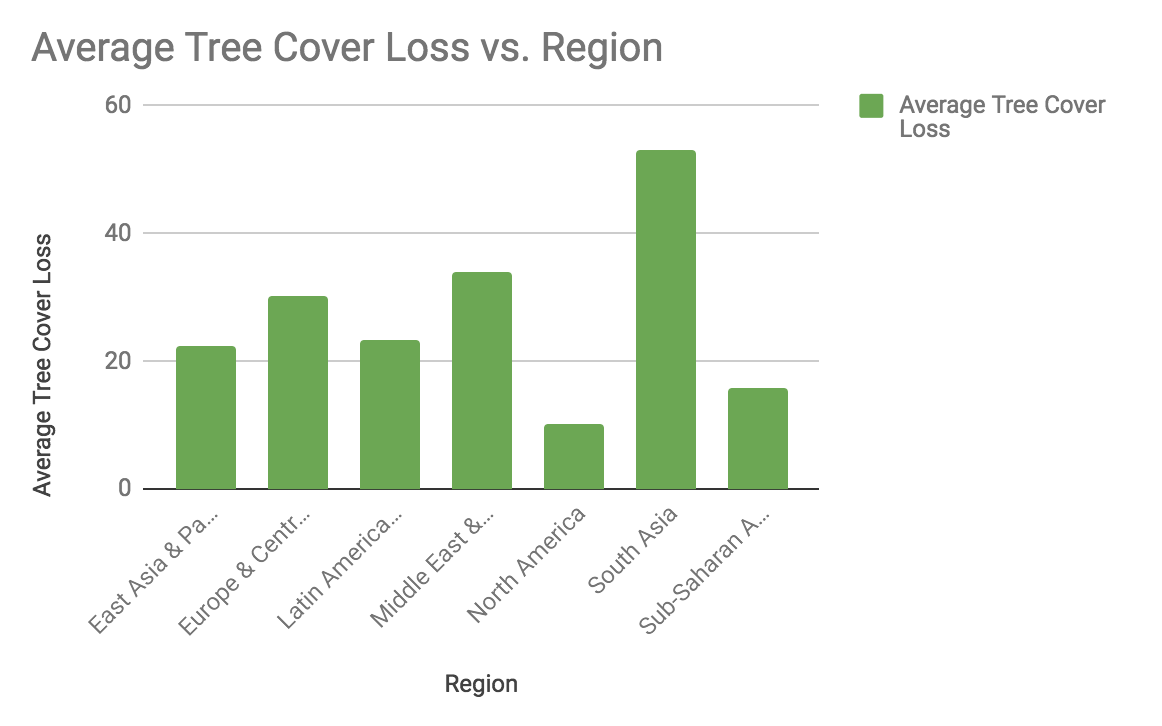 Figure 3.2 |
Our group wanted to look at one of the subgroups of HLT and ECO, so we included average tree cover loss in our statistical analysis. Our analysis reveals that there is no significant relationship between average tree cover loss and EPI. ECO accounts for 60% of the overall EPI, and TCL accounts for 10% of ECO.
Discussion
| The 2018 EPI supplies a quantitative framework for comparing, analyzing, and understanding environmental performance for 180 countries (Environmental Performance Index). The EPI ranks the environmental performance of these countries using the most recent data available. We used data collected by the Yale EPI in combination with the indicators used by the World Bank to statistically analyze environmental performance with a particular focus on economics to investigate the validity of the Capitalocene. Before conducting our analysis, we hypothesized that these data may reveal Kutznets curve behavior, where areas of upper-middle and lower-middle income would have the highest EPI and low and high income would have the lowest EPI. | 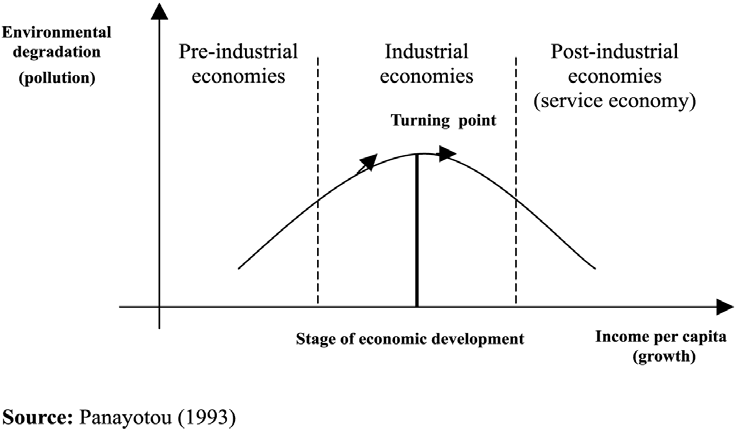 Figure 4 |
Our reasoning behind this assumption is that more developed countries have the highest overall impact in terms of total resource use, emissions and species threatened. In following this thinking, lesser developed regions would have less overall environmental impact. However, our results reveal the opposite, where areas with higher income have the highest EPI and areas with lower income have significantly higher EPIs. This is likely because less developed countries need to make decisions between conflicting goals, notably sustainability goals. In their desire for economic growth and industrialization, countries consume more cheap energy. This encourages over-consumption of energy and waste which perpetuates environmental pollution. This pattern of pollution in developing countries is demonstrated by the environmental Kutznets curve (see Figure 4). The EKC (Environmental Kutznets Curve) is a speculated relationship between indictors of environmental degradation and per-capita income. This theory is built on the idea that environmental degradation and pollution rise in beginning stages of economic growth, peak, and circle back in a way that environmental conditions improve at high income levels. However, our analysis of EPI data did not follow Kutznets curve behavior. Our results instead show a clear increase in environmental performance from poorer countries to wealthier countries, rather than starting low, reaching the top, and declining again.
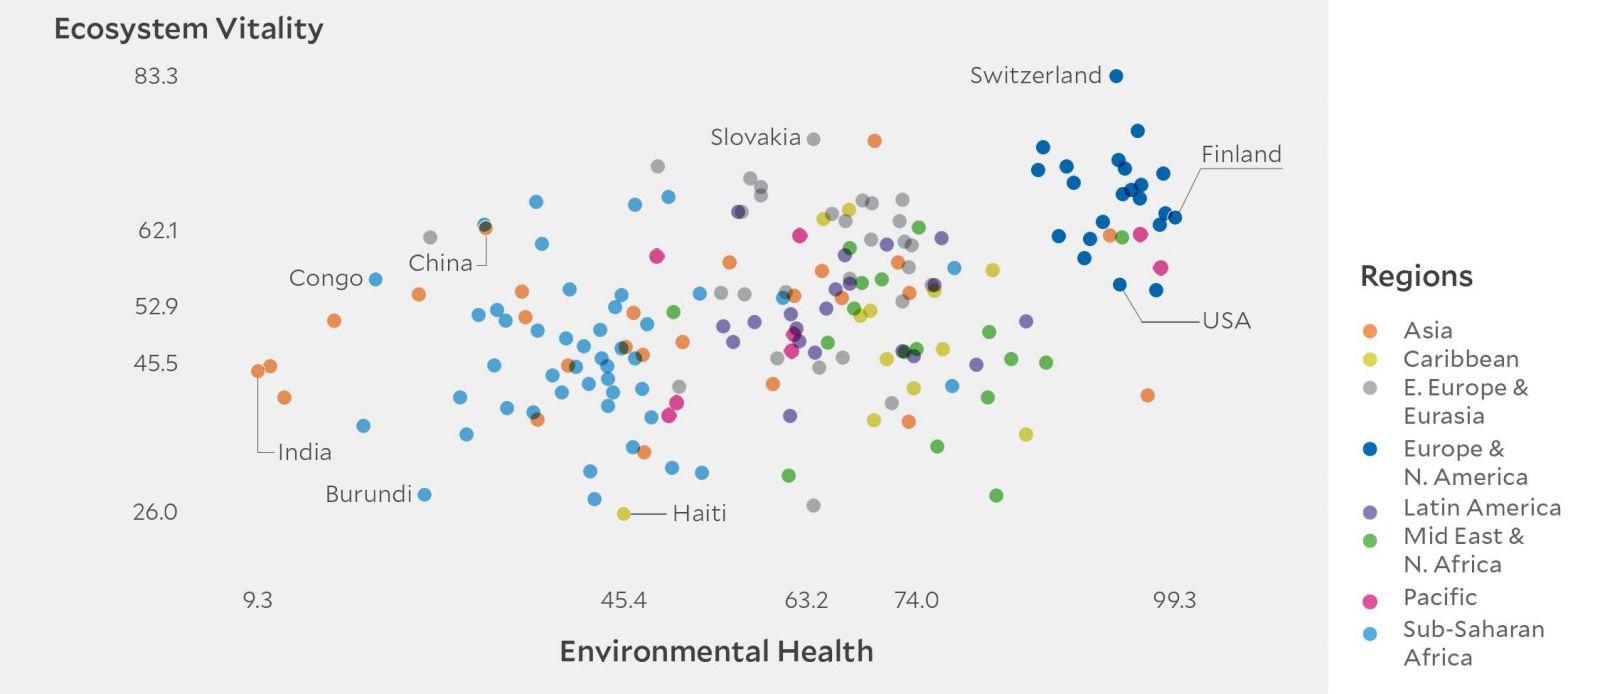
This image from the EPI website shows the relation ship between the two main sub-scores for all 180 countries in the 2018 EPI
Within our lab, we looked to answer the question "How do the main EPI indicators vary by World Bank income classification and by region? As stated earlier, the EPI system scores and ranks environmental performance by country. In our lab, we used the EPI data in conjunction with the World Bank indicators to investigate the economic facet of environmental preservation. This means that rather than analyzing the EPI data by country, we applied these data by region and income group. By using only one value per region, rather than one value per country, we limited the findings of our research.
0 Comments
Leave a Reply.
Treasure McMahan
I am an Environmental Studies and Sociology/Anthropology double major at Lewis & Clark College. This blog page is where I will post my lab write-ups for ENVS 220 "Environmental Analysis"
Archives
December 2018
November 2018
October 2018
September 2018
 RSS Feed
